Stats & spotlight
Stats plots the review scoreboard and token usage; Spotlight highlights the changed lines.
Two surfaces answer "how much" and "how far along." Stats and Metrics quantify a session; Spotlight makes a single change legible inside a heavily edited file.
Stats
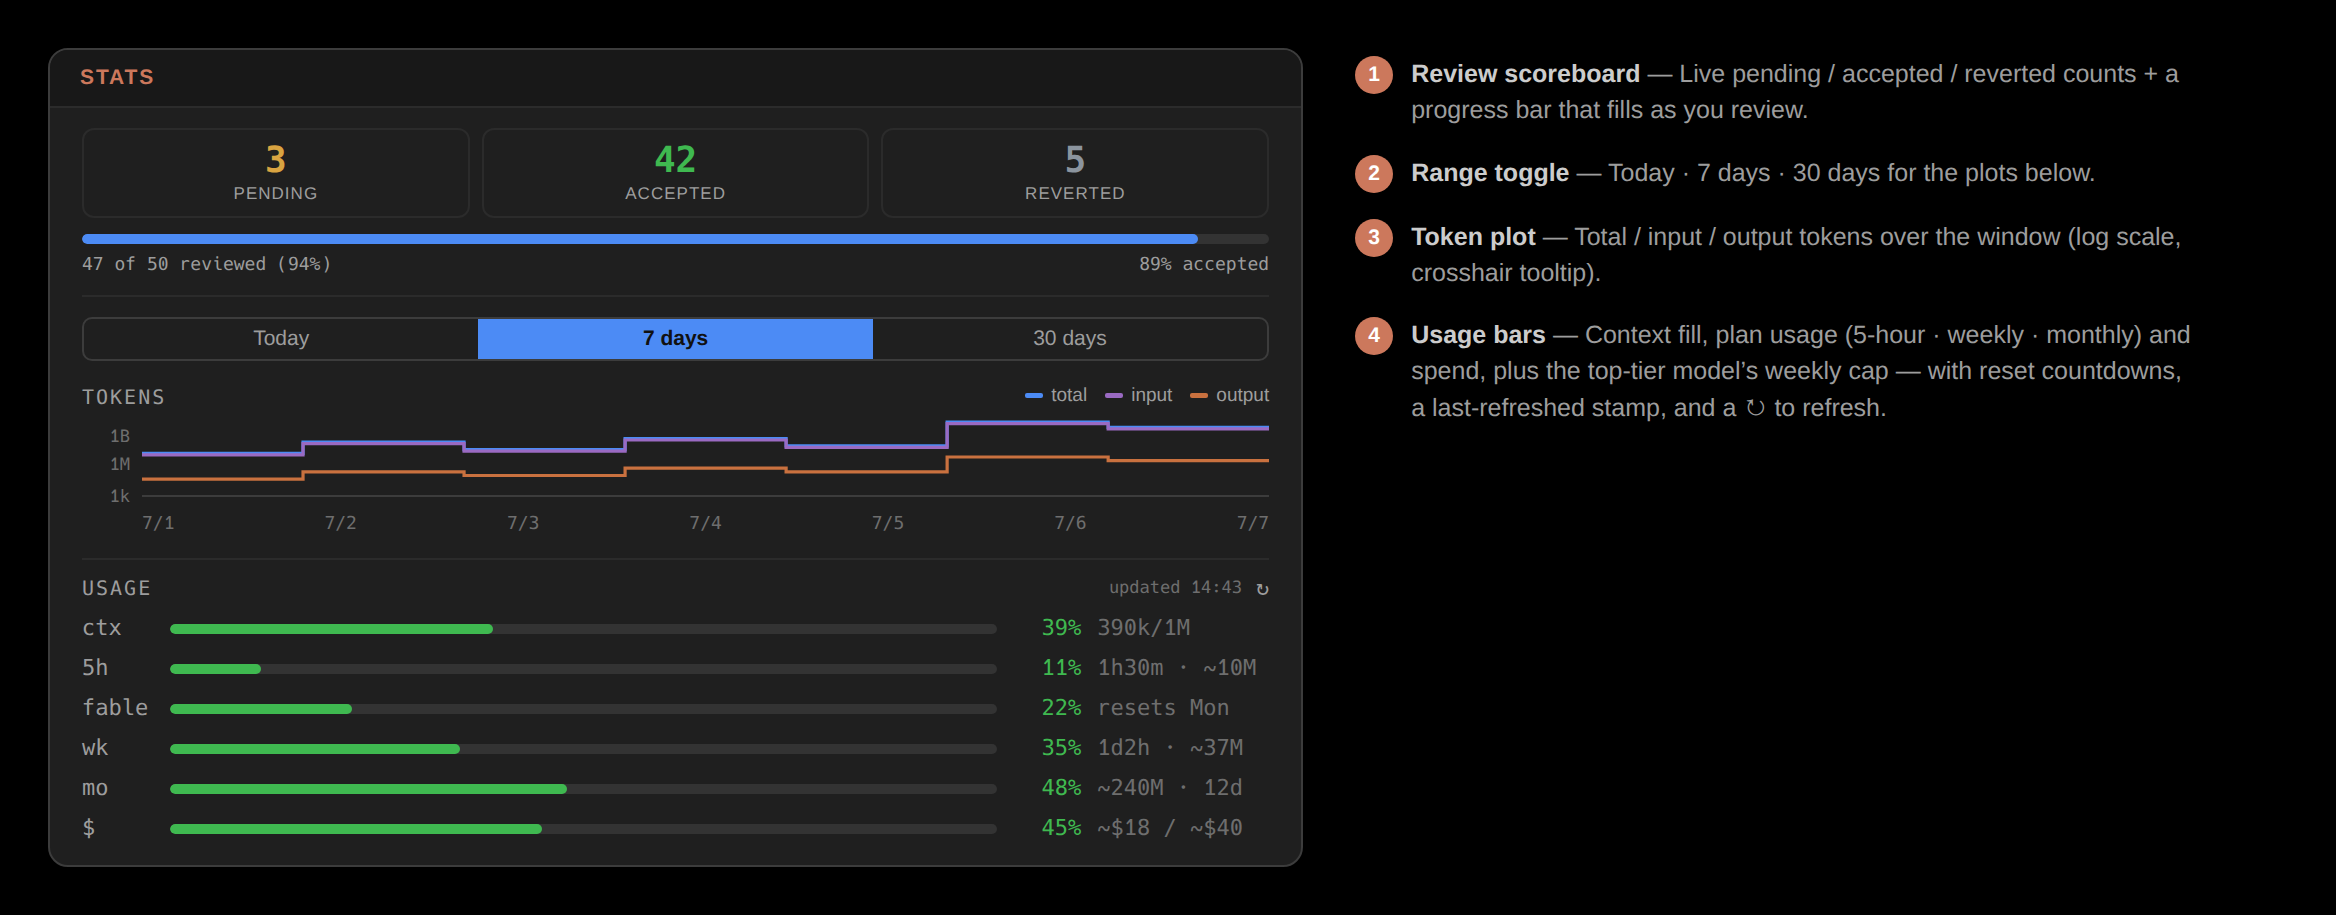
Stats reports the session's vitals and usage: the model and reasoning effort it runs on, cumulative tokens split into input, output, and cached, compaction history, and token plots by time window. At its top is the review scoreboard — pending, accepted, and reverted counts — over a Today / 7 days / 30 days range toggle.
Metrics
Metrics reports derived numbers: line deltas, action and error counts, per-subagent duration and tokens, and tool latency. In short — Stats describes consumption; Metrics describes activity.
The Stats $ row, the status bar's mo ~$ and oak usage --breakdown price a session's token counts at the public API list prices, and a ~ marks each such figure. A subscription is not billed per token, so none of them is a bill.
Spotlight
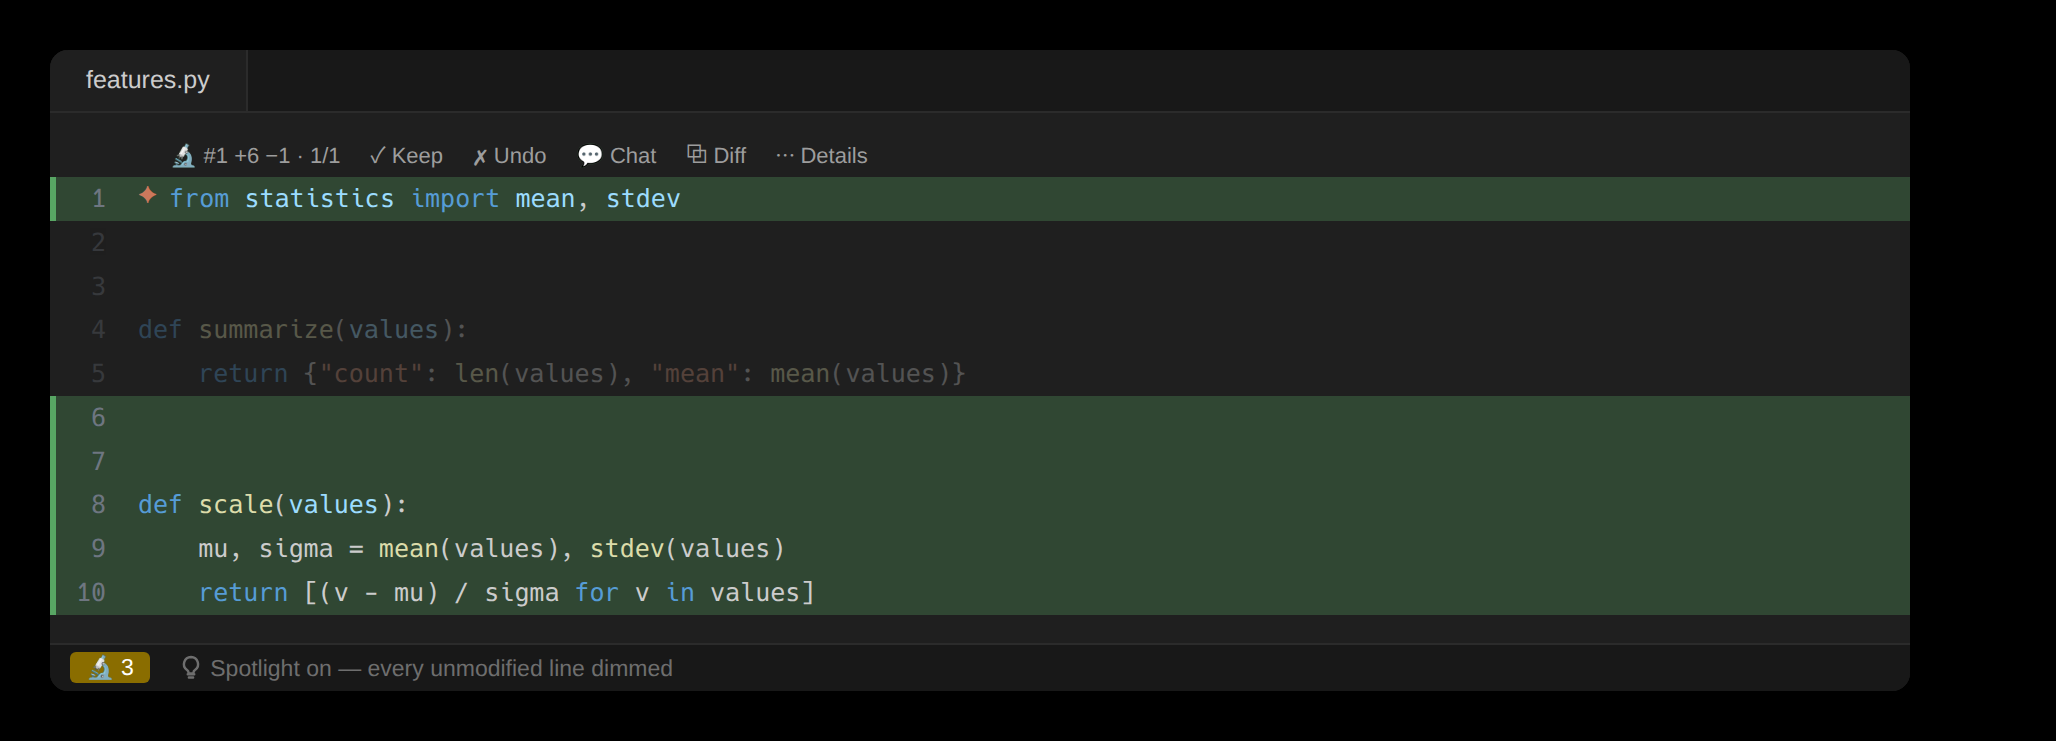
Spotlight dims every line the agent did not change, so the changes read at full contrast in a heavily edited file. It answers "what actually moved here" at a glance when a diff is buried in a large file.